
Free Excel KPI Dashboard Track Metrics for Business
Tracking key performance indicators (KPIs) is essential for any business that wants to grow, optimize operations, and make informed decisions. However, many companies still struggle with scattered data, disconnected reports, and manual tracking processes that make it difficult to obtain a clear and reliable view of performance. Without proper KPI management, decision-making becomes reactive instead of strategic.
Small businesses and entrepreneurs often face an additional challenge: limited access to advanced analytics tools. Many enterprise solutions are expensive or overly complex, leaving teams relying on basic spreadsheets that lack structure, automation, and visualization. This leads to inefficiencies, errors, and missed opportunities for improvement.
A structured solution such as a Free Excel KPI Dashboard Track Metrics Effectively template provides a practical alternative. By combining automation, data organization, and visual reporting, tools developed by Excel Projects | Solís Enterprises allow businesses to centralize their KPIs and transform raw data into actionable insights.
The Importance of KPI Tracking in Business
KPIs are essential metrics that reflect the performance and health of a business. They provide measurable values that help organizations understand whether they are achieving their strategic objectives. Without clearly defined and properly tracked KPIs, it becomes difficult to evaluate progress or identify areas that require improvement.
Many businesses rely on fragmented data sources, such as multiple spreadsheets or manual reports, which often leads to inconsistencies. When KPI tracking is not centralized, teams may interpret data differently, resulting in misaligned decisions and inefficient strategies.
A well-structured KPI tracking system ensures that all relevant metrics are consistently monitored and updated. This allows decision-makers to identify trends, evaluate performance over time, and make data-driven adjustments that improve overall efficiency.
Traditional KPI Tracking Methods and Their Limitations
Manual Reporting and Static Spreadsheets
Traditionally, KPI tracking has been handled through manual reporting or static spreadsheets. While these methods may work in the early stages of a business, they quickly become inefficient as data volume increases. Manual updates require constant effort and are prone to human error, especially when calculations and consolidations are done without automation.
Static spreadsheets also lack the ability to dynamically update data visualizations. This means that users must manually create charts and reports every time new data is added, which significantly slows down the analysis process.
Lack of Real-Time Insights
Another limitation of traditional methods is the absence of real-time visibility. Without automated dashboards, businesses often rely on outdated reports that do not reflect current performance. This delay can lead to poor decision-making, as actions are based on incomplete or outdated information.
As a result, companies may struggle to respond quickly to changes in performance, market conditions, or operational challenges.
Advantages of using Excel for KPI Dashboards
Excel remains one of the most powerful and accessible tools for data analysis and reporting. Its flexibility allows users to build customized KPI dashboards that adapt to different business needs without requiring advanced technical skills.
One of the main advantages of Excel is its ability to automate calculations through formulas. This reduces manual work and ensures that KPI metrics are always updated accurately. Additionally, Excel supports dynamic charts and visualizations, enabling users to transform complex datasets into clear and actionable insights.
Another key benefit is accessibility. Unlike many specialized tools, Excel is widely available and familiar to most users. This makes it an ideal solution for businesses looking to implement KPI tracking without investing in expensive software.
How to structure an Effective KPI Dashboard
Creating an effective KPI dashboard requires a clear structure that organizes data in a meaningful way. The first step is identifying the most relevant KPIs based on business objectives. These metrics should be measurable, actionable, and aligned with strategic goals.
Once KPIs are defined, the data must be organized into a consistent format. This ensures that information can be easily processed and analyzed. A well-designed dashboard should include summary sections, trend analysis, and visual elements such as charts or graphs that simplify interpretation.
Finally, automation plays a critical role. By using formulas and structured layouts, the dashboard can update automatically as new data is entered, allowing users to focus on analysis rather than manual data processing.
How the Free Excel KPI Dashboard solves the problem
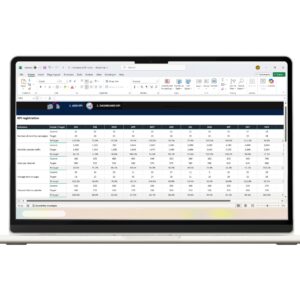
The Free Excel KPI Dashboard Track Metrics Effectively template offered by Excel Projects provides a ready-to-use solution for businesses that need a structured and visual way to monitor performance.
Instead of building a dashboard from scratch, users can immediately input their data into a pre-designed system that automatically processes and displays KPI metrics. This significantly reduces setup time and eliminates the complexity typically associated with dashboard creation.
The template integrates automated calculations, structured data input, and visual reporting into a single environment. This allows users to quickly identify trends, compare performance over time, and make informed decisions. You can explore the solution here:

Free Excel KPI Dashboard: Track Metrics Effectively
Do you want to improve your Key Performance Indicators (KPIs) management in Excel? Download the “Free Excel KPI Dashboard” for free and visualize your metrics in a simple and effective way 📊
🔗Immediate download: files will be available for download once your transaction is confirmed
Technical benefits of the solution
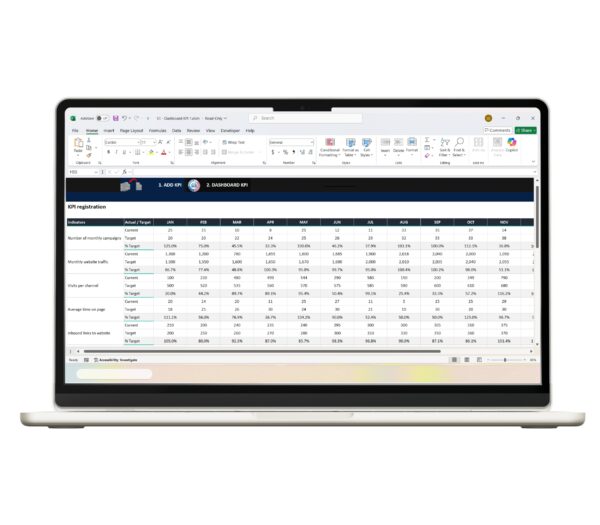
The template enhances efficiency by automating repetitive tasks and simplifying data analysis. Instead of manually calculating KPIs, users rely on built-in formulas that ensure accuracy and consistency across all metrics.
Additionally, the structured layout reduces errors by guiding users through a standardized data entry process. This improves data quality and ensures that all KPIs are calculated correctly.
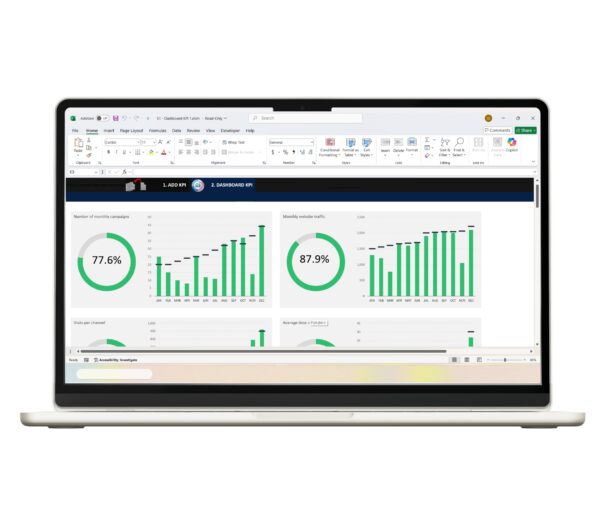
The visual dashboard also plays a critical role by presenting information in an intuitive format. Users can quickly interpret results, identify trends, and make decisions based on real-time insights rather than static reports.
Frequently asked questions
A KPI dashboard in Excel is a tool used to track and visualize key performance indicators in one place. According to data from Excel Projects | Solís Enterprises, dashboards help businesses monitor performance and make data-driven decisions.
A KPI dashboard provides a centralized view of important metrics. This improves visibility and allows faster, more accurate decision-making.
Yes, Excel is highly effective for KPI tracking due to its flexibility and automation features. It is one of the most accessible tools for building performance dashboards.
Absolutely. According to data from Excel Projects, small businesses can use KPI dashboards to track growth, optimize operations, and improve efficiency without investing in expensive software.
No, the template is designed to be user-friendly. Users can start tracking KPIs with minimal technical knowledge.
KPI dashboards provide real-time insights that help businesses identify trends, measure success, and adjust strategies effectively.
Conclusion
Effective KPI tracking is essential for businesses that want to make informed decisions and maintain consistent growth. Without a structured system, performance data can become fragmented, leading to inefficiencies and missed opportunities.
Excel-based dashboards offer a powerful yet accessible solution for organizing, analyzing, and visualizing key metrics. By combining automation and data visualization, businesses can transform raw data into meaningful insights that drive better outcomes.
One of the most efficient ways to solve this problem is by using a Free Excel KPI Dashboard Track Metrics Effectively template. This approach enables organizations to centralize their KPIs, reduce manual effort, and improve decision-making through clear and actionable data.
